


VG Global Growth Celebrates its 10th Birthday and Number One Status
It was ten years ago we launched VG Global Growth. And what a way to celebrate–with a number one peer ranking according to PSN! *
According to Forbes, “The great bull market of 2013 lived up to its name on New Year’s Eve, with the Dow, Nasdaq and S&P 500 closing in the green across the board. The Dow closed at a record-high 16,576.66…” Ten years later the Dow has more than doubled, coming in at 35,176.15 at the market close on August 10, 2023.
But this is not a story about exceptional performance or how we beat all other peers in the category. Nor is it a story about how far you can go riding the bull of secular market–which we wrote about back in January of this year. No. This is a story about the true source of meaningful results—through investment process.
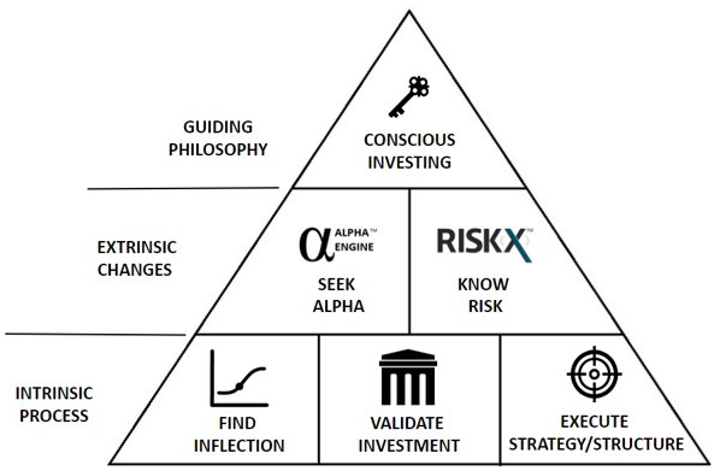
We believe consistent investing begins with:
- A deep connection to a strong guiding philosophy
- An appreciation for the extrinsic change between risk and reward
- The intrinsic process that fulfills a guiding philosophy and evolves as markets change
It is number 3 where the heavy lifting happens. It is the internal process that fulfills our philosophy of conscious investing, looks to find alpha and understands the X factor of risk in an external world of constant change. It is where we search for emerging points of inflection, validate investment potential and execute the best strategy and structure to deliver that potential.
And we believe Global Growth is proof our process works. It is why we are celebrating this glorious day with you, and it is why we expect to celebrate the success of all our strategies for decades to come.
Happy 10th Birthday VG Global Growth!
Cheers!
Are you a Financial Professional? Then check out our new portal and get all kinds of tools and resources on multi-strategy investing, and growth.
IMPORTANT DISCLOSURE:
Securities highlighted or discussed in this blog have been selected to illustrate Validus’s investment approach and/or market outlook and are not intended to represent any strategy or portfolio performance or be an indicator for how strategy or portfolio have performed or may perform in the future. Each security discussed in this blog has been selected solely for this purpose and has not been selected on the basis of performance or any performance-related criteria. The securities discussed herein do not represent an entire portfolio and, in aggregate, may only represent a small percentage of a strategy or portfolio holdings. The strategies and portfolios are actively managed, and securities discussed in this blog may or may not be held in such strategies or portfolios at any given time. These individual securities do not represent all the securities purchased, sold, or recommended and the reader should not assume that investments in the securities identified and discussed were or will be profitable. Nothing in this blog shall constitute a recommendation or endorsement to buy or sell any security or other financial instrument referenced in this letter.
Validus Growth Investors, LLC seeks to invest in companies at every stage of their growth. From startups to publicly traded companies, our research identifies inflection points that have the potential to produce meaningful growth and income for the clients we serve.
Investment Advisory Services are offered through Validus Growth Investors, LLC (“Validus”), an SEC Registered Investment Adviser. No offer is made to buy or sell any security or investment product. This is not a solicitation to invest in any security or any investment product of Validus. Validus does not provide tax or legal advice. Consult with your tax advisor or attorney regarding specific situations. Intended for educational purposes only and not intended as individualized advice or a guarantee that you will achieve a desired result. Opinions expressed are subject to change without notice. Investing involves risk, including the potential loss of principal. No investment can guarantee a profit or protect against loss in periods of declining value. All information is believed to be from reliable sources; however, we make no representation as to its completeness or accuracy. Opinions and projections are as of the date of their first inclusion herein and are subject to change without notice to the reader. As with any analysis of economic and market data, it is important to remember that past performance is no guarantee of future results.
* PSN Enterprise [Zephyr] is a product of Informa Investment Solutions, Inc. PSN is an investment manager database and is a division of Informa Investment Solutions, Inc.
PSN is its robust historical database of nearly 40 Years of Data Including Net and Gross-of-Fee Returns. For more details on the methodology behind the PSN Top Guns Rankings or to purchase PSN Top Guns Reports, contact Margaret Tobiasen at Margaret.tobiasen@informa.com. Visit PSN online to learn more.
1-Star Category: had one of the top ten returns for the quarter in their respective strategy.
2-Star Category: had one of the top ten returns for the one-year period in their respective strategy.
3-Star Category: had one of the top ten returns for the three-year period in their respective strategy.
4-Star Category: had an r-squared of 0.80 or greater relative to the style benchmark for the recent five-year period. Moreover, the strategy’s returns exceeded the style benchmark for the three latest three-year rolling periods. The top ten returns for the latest three-year period then become the 4 Star Top Guns.
5-Star Category: had an r-squared of 0.80 or greater relative to the style benchmark for the recent five-year period. Moreover, the strategy’s returns exceeded the style benchmark for the three latest three-year rolling periods. Products are then selected which have a standard deviation for the five-year period equal or less than the median standard deviation for the peer group. The top ten returns for the latest three-year period then become the 5 Star Top Guns.
6-Star Category: had an r-squared of 0.80 or greater relative to the style benchmark for the recent five-year period. Moreover, the strategy’s returns exceeded the style benchmark for the three latest three-year rolling periods. Products are then selected which have a standard deviation for the five-year period equal or less than the median standard deviation for the peer group. The top ten information ratios for the latest five-year period then become the 6 Star Top Guns.
Manager of the Decade: had an r-squared of 0.80 or greater relative to the style benchmark for the latest 10-year period. Moreover, the strategy’s returns were greater than the style benchmark for the latest 10-year period and also standard deviation less than the style benchmark for the latest ten-year period. At this point, the top ten performers for the latest 10-year period become the PSN Top Guns Manager of the Decade.
Bull & Bear Masters: had an r-squared of 0.80 or greater relative to the style benchmark for a three-year period. Moreover, the strategy had an upside market capture over 100 and a downside market capture less than 100 relative to the style benchmark. The top ten ratios of Upside Capture Ratio over Downside Capture Ratio become the PSN Bull & Bear Masters.
The complete list of PSN Top Guns and an overview of the methodology can be located at https://psn.fi.informais.com/. Registration is required.
PSN Global/International ADR – Includes all global or international equity products that select “American Depository Receipts” under primary equity style as very important. Universe is available on both gross and net of fee basis.
Quartile Ranking Bar – The Quartile Ranking graph is used to rank the performance of PSN managers, market indexes or your own self-entered products against a universe. The range of returns/other modern portfolio characteristics in the universe are represented by floating bars. Each bar is broken up into 4 quartiles. The upper quartile represents the top 25% of the managers in the particular universe for the particular time period. The managers, indexes, and portfolios are plotted relative to the floating bars.
Multi-Statistic Quartile Ranking Bar – The Multiple Statistics Quartile Ranking graph is used to rank various performance and statistics of PSN managers, market indexes or your own self-entered products against a universe. The range of returns/ other modern portfolio characteristics in the universe are represented by floating bars. Each bar is broken up into 4 quartiles. The upper quartile represents the top 25% of the managers in the particular universe for the particular time period . The managers, indexes and portfolios are plotted relative to the floating bars.
Market Capture – The Upside vs. Downside Market Capture graph measures the market shares captured by a product for a selected date range; it further reveals the market trend of the selected product to show the capture ratio pattern of the product relative to a market index. Similar to the risk return graph, this graph is broken down into four quadrants relative to the upside to downside capture ratio instead of risk and return. The 100% capture ratio of the up market and the down market determines the intersection of the quadrants. The graph indicates the number of up quarters, return of the portfolio in an up market, return of the market index in an up market; percent of market capture in an up market, number of down quarters, return of the portfolio in a down market, return of the market index in a down market, and percent of market capture in a down market.
Market Risk / Reward – The Market Risk Reward graph is used to compare the excess performance and market risk (beta) of selected managers against the excess performance and market risk of a market index for a specific period of time. The graph is broken down into 4 quadrants: Less Risk-Less Return, Less Risk-More Return, More Risk-More Return, and More Risk-Less Return. The risk index determines the intersection of the quadrants. In addition to the excess rate of return and beta, the analysis also calculates optional risk statistics such as tracking error, information ratio, alpha, and r-squared.
Active Share – Active share is the percentage of fund holdings that are different from the benchmark holdings. Active share is calculated as one-half times the sum of the absolute value of the differences in weights between an investment portfolio and its corresponding index.
Different types of investments and/or investment strategies involve varying levels of risk, including loss of principal, and there can be no assurance that any specific investment or investment strategy will be suitable or profitable for a client’s or prospective client’s portfolio.
You should always seek counsel of the appropriate advisor prior to making any investment decision. All investments are subject to risk including the loss of principal. This material was gathered from sources believed to be reliable, however, its accuracy cannot be guaranteed.